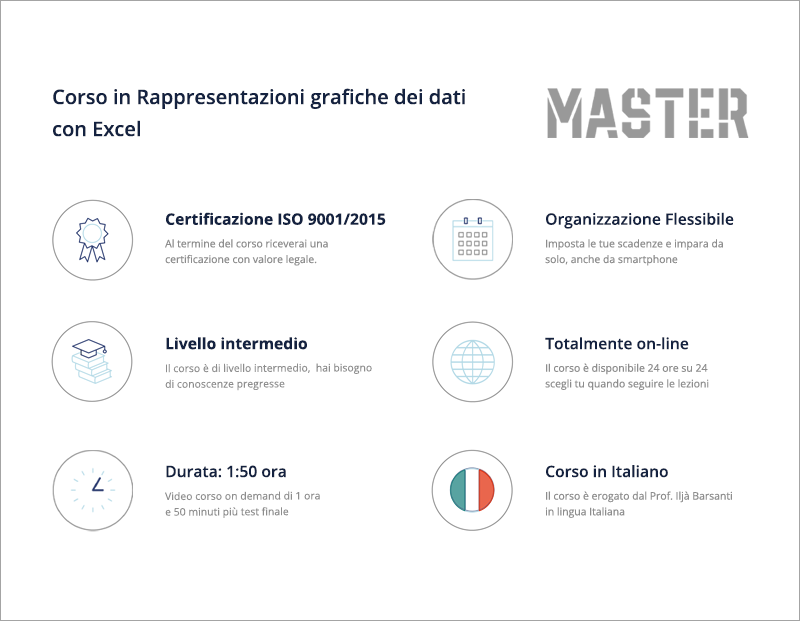
Corso in Rappresentazioni grafiche dei dati con Excel
Per il Corso in Rappresentazioni grafiche dei dati con Excel abbiamo scelto il Prof. Iljà Barsanti, insegnante di Statistica a vari livelli, è stato professore di Statistica all’Università Uninsubria, lo è stato anche a Pisa e Sapienza. Inoltre formatore aziendale e docente negli enti di formazione e dal 2019 Coach Professionista. Alla fine del corso riceverai un certificato di formazione, una garanzia certificata della tua formazione per qualsiasi datore di lavoro.

Contenuto del Corso
Creazione di un grafico a torta
You don't currently have access to this content
Impostazioni grafiche
You don't currently have access to this content
Diagramma a barre
You don't currently have access to this content
Grafici a dispersione
You don't currently have access to this content
Tutti i grafici
You don't currently have access to this content
Grafici pivot
You don't currently have access to this content
Istogrammi
You don't currently have access to this content
Grafici Statistici
You don't currently have access to this content
Grafici combinati
You don't currently have access to this content
Grafici speciali
You don't currently have access to this content
Mappe
You don't currently have access to this content
Test finale
You don't currently have access to this content
Ratings and Reviews
5.0
Avg. Rating
1 Ratings
5
1
4
0
3
0
2
0
1
0
What's your experience? We'd love to know!
Login to Review
What's your experience? We'd love to know!
Login to Review


Rapido e focalizzato sui temi grafici con apporti di lettura statistica molto utili